Smart Insights for Balancing Demand, Carbon, and Flexibility
The energy industry is at a crossroads. Electricity demand continues to rise, renewables are scaling at record speed, carbon policies are becoming more stringent, and storage technologies are evolving into core system assets. In this dynamic environment, static reports no longer suffice. Executives need interactive dashboards that bring real-time visibility, predictive insights, and actionable intelligence—tools that don’t just show the past but illuminate the future.
Executive Context
Why Dashboards Matter:
Demand Growth: Electricity consumption is growing steadily, and traditional reporting cannot adapt quickly enough to shifting demand patterns. Real-time dashboards enable adaptive planning, ensuring supply meets demand while reducing the risk of outages.
Renewables Integration: Wind and solar resources bring variability that introduces operational uncertainty. Executives need live monitoring tools to manage these fluctuations. Data-driven dashboards empower utilities to maximize renewable penetration while keeping grids stable.
Storage: Energy storage is essential for balancing supply and demand during peak times. By tracking State of Charge (SOC), charging/discharging cycles, and costs, dashboards help operators optimize storage use, improve resilience, and lower costs.
Emissions Policies: Carbon pricing and sustainability targets are non-negotiable. By integrating emissions data into operational dashboards, leaders can assess carbon costs alongside financial performance and align business strategies with net-zero goals.
Cresco’s Value Proposition: Cresco transforms static reports into dynamic decision-making platforms. With interactive dashboards, leaders can:
Simulate future demand and renewable scenarios
Monitor performance across demand, carbon, and flexibility in real time
Decide with transparency, confidence, and speed
The result: a more sustainable, flexible, and carbon-aware energy future.
Business Drivers
Planning in a Volatile World
External pressures make data-driven insights more critical than ever.
Uncertainty in Fuel Costs: Volatile coal, gas, and oil prices, driven by geopolitics and supply chain shocks, create unpredictable margins. Cresco dashboards let leaders model multiple fuel price scenarios to reduce risk.
Carbon Price Sensitivity: Even small policy shifts can reshape cost structures. With Cresco tools, executives can test carbon price scenarios and quantify impacts before they materialize.
Renewables + Storage Integration: To stabilize intermittency, renewables and storage must be modeled together. Cresco provides a unified view of generation, storage, and grid reliability.
Real-Time Planning: Yesterday’s assumptions don’t hold today. Cresco dashboards provide instant visibility into changing conditions, enabling agile decision-making.
Building the Analytical Backbone
Dynamic decision-making requires a foundation of accurate data and robust models.
Cresco integrates:
Data Sources: demand forecasts, generation availability, storage specs, fuel costs, carbon prices, and transmission constraints.
Model Engine: unit commitment, dispatch results, storage cycles, and plant efficiency factors.
Key KPIs: reliability, cost-to-serve, emissions, carbon costs, and storage utilization, calculated transparently in Power BI using DAX.
This backbone ensures that dashboards reflect operational reality, not just theoretical estimates, and gives leaders the ability to explore scenarios, simulate operational decisions, and act with confidence.
Scalable Power BI Framework
Cresco’s dashboards are designed for consistency, scalability, and governance.
Corporate branding applied with JSON themes
Calendar tables for time-based insights (year, quarter, month, hour)
Centralized measures table for clean and auditable KPIs
Reusable Power BI templates (.pbit) for rapid deployment
Row-level security for role-based access
This repeatable methodology ensures that utilities, regulators, and planners benefit from a standardized yet adaptable framework.
Modular Dashboard Architecture
Cresco’s dashboard suite is modular, with each component offering a different lens on grid operations:
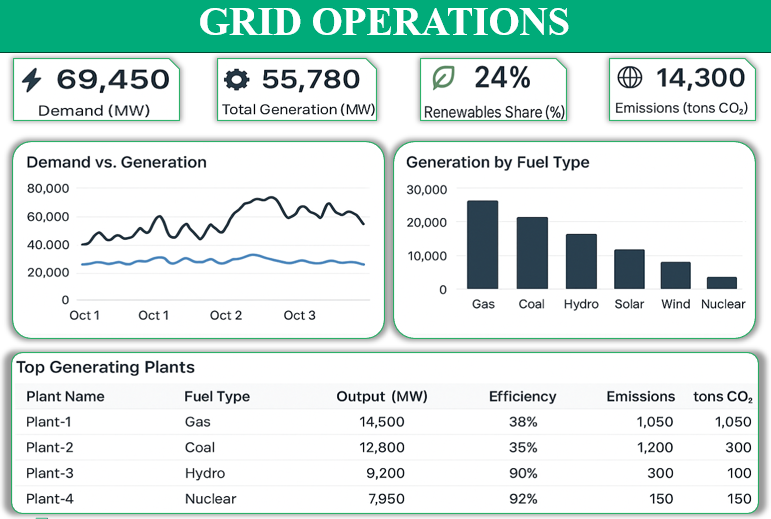
Grid Operations: Real-time demand vs. supply, dispatch, and system reliability
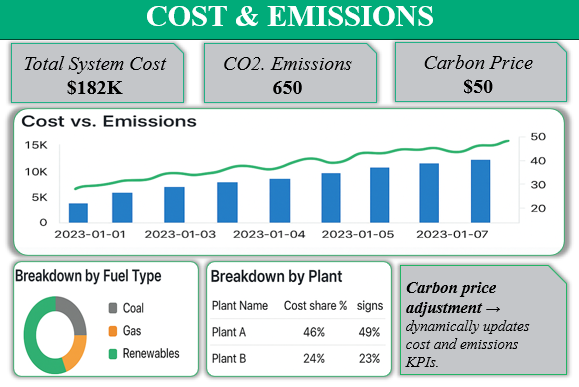
Cost & Emissions: System cost, carbon intensity, and carbon pricing scenarios
Capacity & Reserves: Resource adequacy, peak vs. available capacity, and reserve margins
Transmission & Congestion: Line loading, bottleneck identification, and renewable curtailment
Storage Utilization: SOC tracking, charge/discharge patterns, and asset performance
The modular design makes it easy for leaders to focus on what matters most, while interactive drilldowns enable exploration from system-wide views down to individual assets.
Spotlight Dashboards: From Operations to Strategy
Grid Operations: A live “control panel” that shows demand, generation, renewable share, and emissions in real time.
Cost & Emissions: Explore trade-offs between financial and environmental outcomes, with sliders to model carbon prices.
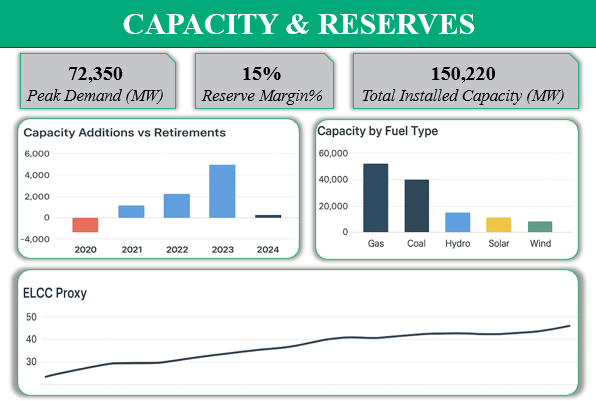
Capacity & Reserves: Assess long-term reliability by tracking reserve margins and technology mix.
Transmission & Congestion: Identify bottlenecks that increase costs and limit renewable integration.
Storage Utilization: Optimize flexibility by monitoring SOC trends, charging/discharging cycles, and unit performance.
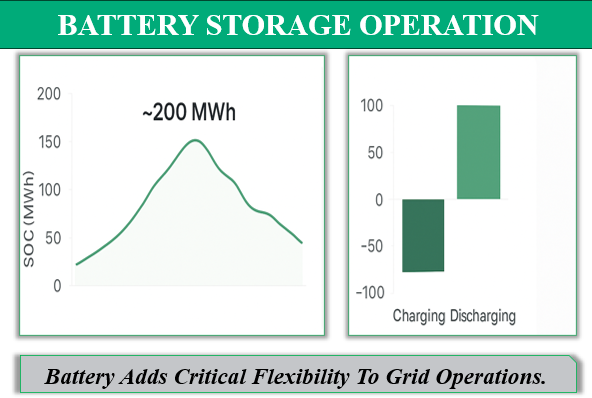
Battery Operations: Analyze charging and discharging behaviours to see how storage smooths renewable variability.
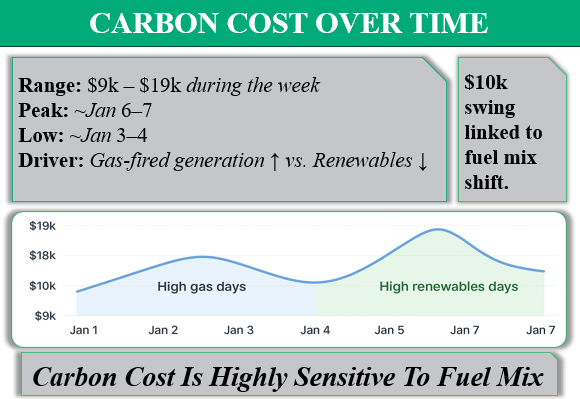
Carbon Cost Over Time: Quantify the financial impact of emissions and highlight cost swings tied to fuel mix.
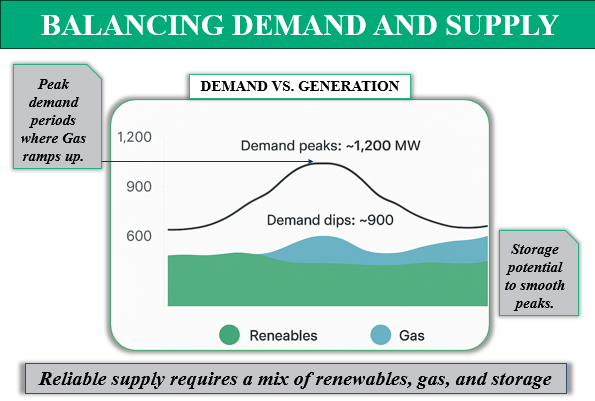
Demand vs. Generation: Track real-time supply gaps and the interplay between renewables, gas, and storage.
What-Ifs + Next Steps: Adjust carbon prices, renewable targets, battery sizes, and fuel sensitivities to see how policy and market changes impact costs, emissions, and reliability.
From Insight to Impact
Cresco’s Power BI dashboards are more than visualizations—they are strategic enablers. By connecting data, models, and KPIs into one ecosystem, they empower executives to:
Maintain real-time system balance
Quantify financial vs. sustainability trade-offs
Plan long-term resource adequacy
Identify hidden constraints in transmission
Optimize storage deployment
Test policies and market shifts before they happen
In today’s volatile energy landscape, the ability to move from insight to action is a competitive advantage. With Cresco’s interactive dashboards, leaders can make decisions that are faster, smarter, and aligned with a sustainable, flexible, and carbon-aware future.